The iSENSE team has released v5.8 and is excited to introduce the following new features:
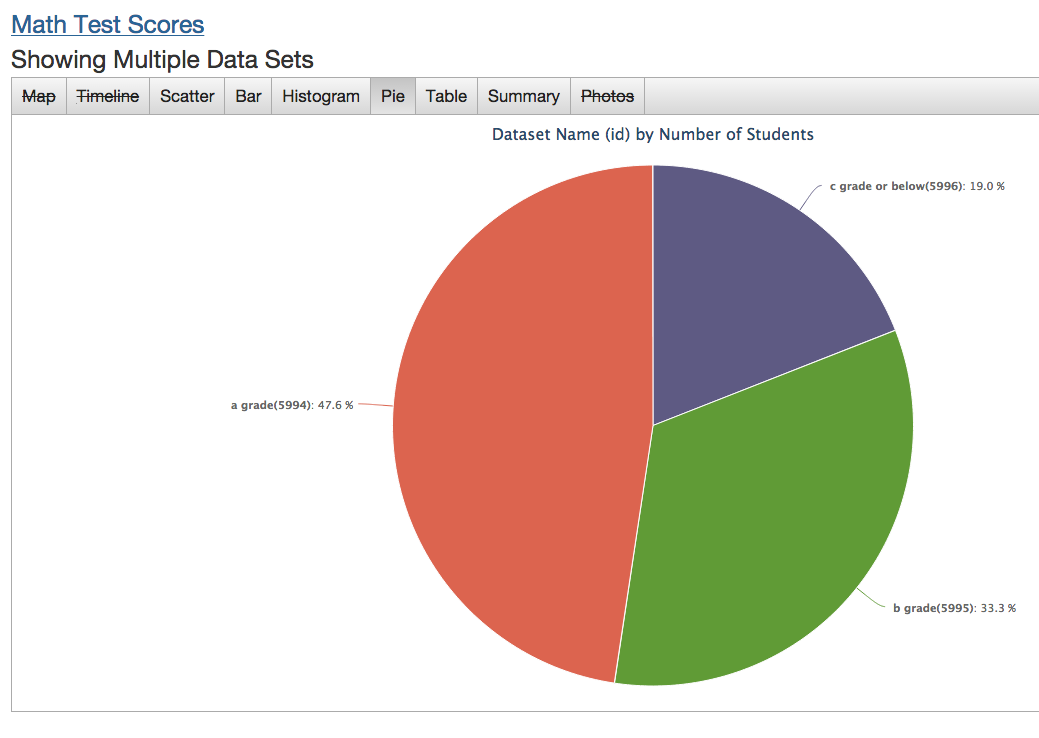
Pie Charts
Pie charts offer another “delicious” way to visualize and analyze your data.
Configurable Floating Point Precision for Visualizations
With configurable floating point precision, you can control the precision of your data to make bar and summary visualizations more readable. For example, 2.349874 will appear as 2.35 if you set your project's floating point precision to be 2.
Four is the default number of decimal points, but you can configure precision in a project’s settings. To access a project’s settings, go to the project page, and click the Edit button as shown below.
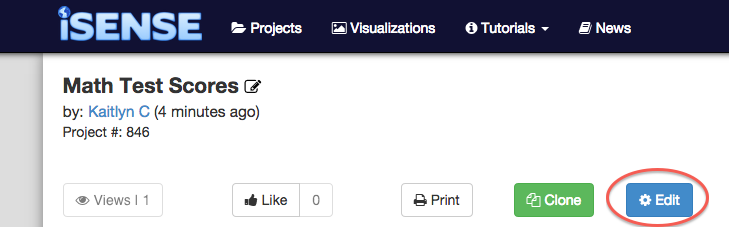
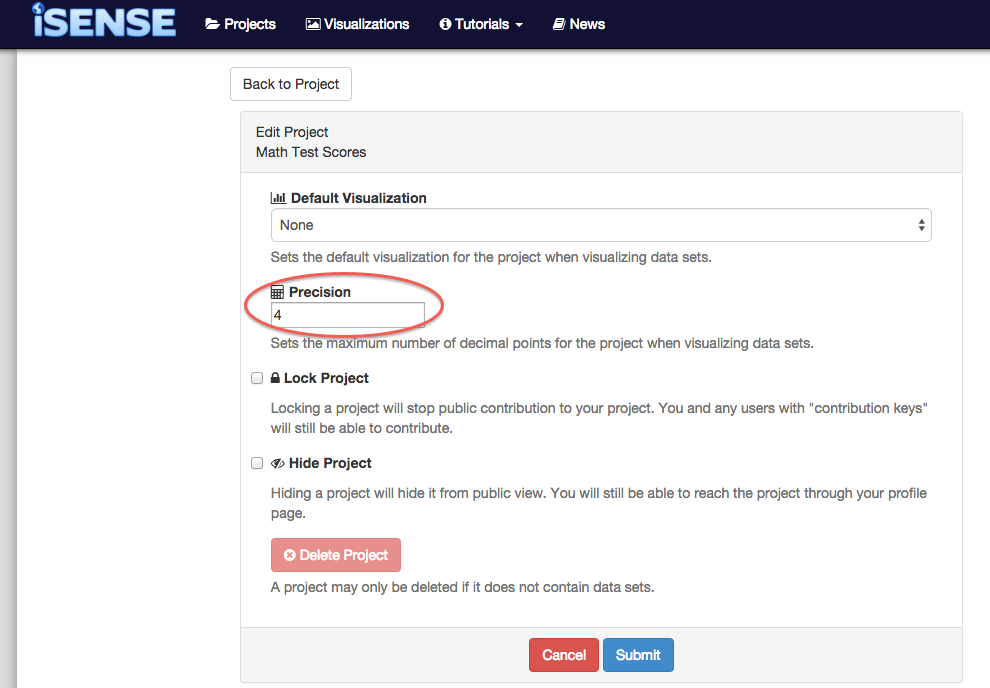
On the project's settings page, enter a number into the precision input box to set the project's floating point precision.
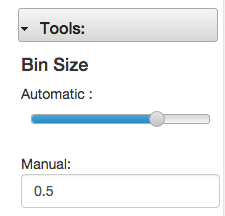
Better Bin Sizing Controls on Histogram Visualization
Bin sizing controls have been improved to make visualizing data on histograms a more seamless experience. To increase the bin size on a histogram visualization, move the slider to the right. To decrease the bin size, move the slider to the left. You can also manually set the bin size by entering a number into the manual input box.
... and more!
In addition to these wonderful new features, this release offers new bugs fixes for regression tools, bar chart sorting, and field matching as well as UI tweaks on the embedded visualization pages.