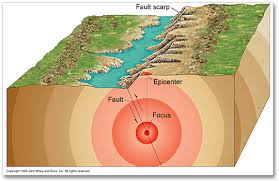
In our studies of Earth Science and plate tectonics, we've realized that when tectonic plates interact with one another, earthquakes can occur. An earthquakes' intensity is, in part, recorded in terms of its magnitude. The magnitude is a measure of the amount of energy released during an earthquake. The list below associates different magnitudes with the effects.
Magnitude
Earthquake Effects
2.5 or less
Usually not felt, but can be recorded by seismograph.
2.5 to 5.4
Often felt, but only causes minor damage.
5.5 to 6.0
Slight damage to buildings and other structures.
6.1 to 6.9
May cause a lot of damage in very populated areas.
7.0 to 7.9
Major earthquake. Serious damage.
8.0 or greater
Great earthquake. Can totally destroy communities near the epicenter
Use the visualizations below to get an understanding of the magnitude of earthquakes that have occurred in the United States and its territories between the years 2000 through 2015.
Guiding Questions
1. What information does the default Bar Chart visualization tell you? 2. What can the histogram tell you about the number of earthquakes that have occurred? 3. In which state(s) has most of the earthquakes occurred between 2000 and 2015?
Note: This data was downloaded initially into an Excel spreadsheet from the National Centers for Environmental Information - https://www.ngdc.noaa.gov/hazard/earthqk.shtml. The data (though comma delimited) would not load, so I manually entered all US earthquake data between the years 2000 and 2015.