Lactose Intolerance by Ethnicity - Geography
Project #1590 on iSENSEProject.org
This data set will be used to introduce the impact genetic mutation can have on individuals, as well as how it can fuel evolution.
Humans are the only species that drink milk as adults, let alone another species' milk. Approximately two thirds of the world's adult human population is lactose intolerant. The ability to digest lactose, the sugar naturally found in milk, requires the ability to make lactase. Lactase is an enzyme that breaks down lactose. About 10,000 or so years ago, a single mutation on a single gene, located near the area where the gene to make lactase is located, occurred. This mutation substituted just one nucleotide for another, namely a cytosine was replaced by a thymine. Had this not occurred, it is speculated that the human population may not have been able to develop an agrarian life-style, relying on hunting and gathering for a much longer period of time. Additionally, those with the mutation had healthier progeny than those without the mutation, allowing the mutation to spread quickly throughout Northern Europe. (Reference: http://www.nature.com/news/archaeology-the-milk-revolution-1.13471.)
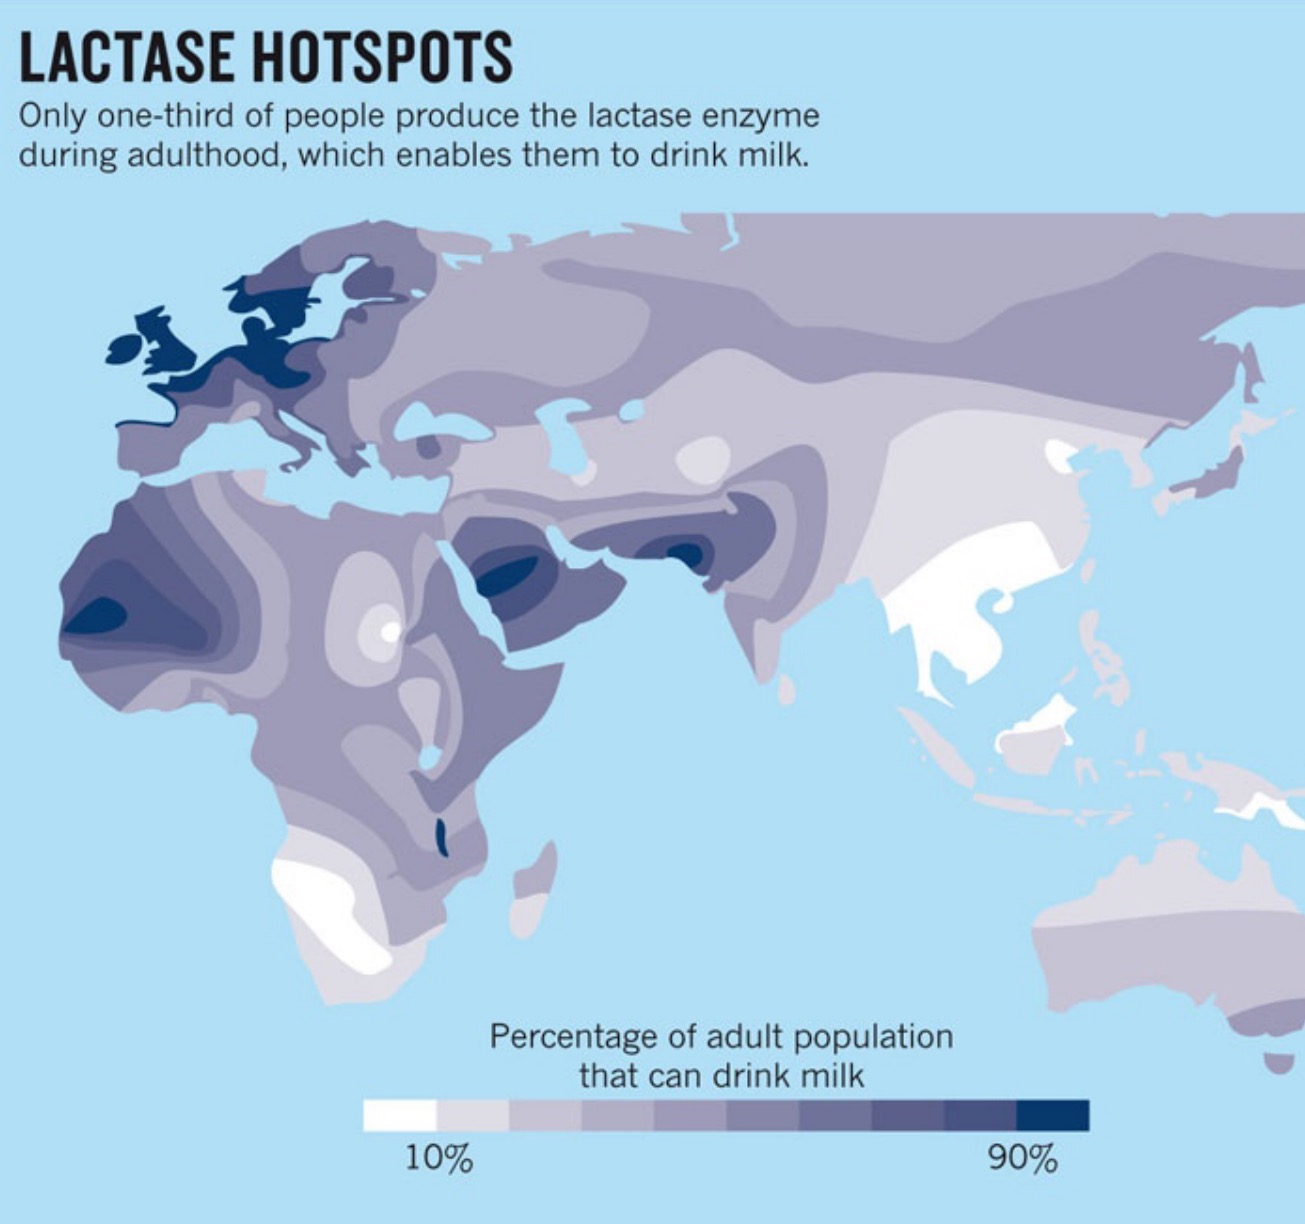
The accompanying data can be used to demonstrate the percentage of the current world population that is lactose intolerant by geography (and ethnicity). By examining the data in specific ways, students can see how individuals from northern climes are more likely to have the mutation than those in other areas and examine this in light of lifestyles.
Guiding Questions
1. What do you notice about lactose intolerance between individuals in the following regions?
a. Northern and Southern France
b. Northern and Southern India
c. Indigenous North Americans and Anglo North Americans
d. Finnish, Austrian, German, and British (UK)
2. Using the world maps provided, shade in those areas with the highest populations of lactose tolerant individuals. What do you notice about these regions?
3. How would you explain the differences in lactose tolerance/intolerance in the various regions?
Data Source
ProCon.org http://milk.procon.org/view.resource.php?resourceID=000661 *
* The following categories were reported as a range of percents in the original data. In order to utilize the data in iSense, the middle of the range was used to create the visualization.
Region Range Percent Used in iSense
East Asia 90-100 95
Indigenous N.A. 80-100 90
African 70- 90 80
Ashkenazi Jew 60- 80 70
Austria 15-20 17
British (UK) 5-15 10
Italian 20-70 45**
**Would probably exclude this data given the broad range. Italy was not divided into Northern and Southern, which may have been why the range is so great. For example, Northern France lactose intolerance rate is 17% and Southern France is 65%, a range of 38. Italy's range is 50.
| Name | Units | Type of Data |
|---|---|---|
|
Ethnicity/Geographical Region
|
None
|
Text
|
|
Percent with Lactose Intolerance
|
None
|
Number
|
| Ethnicity/Geographical Region | Percent with Lactose Intolerance |