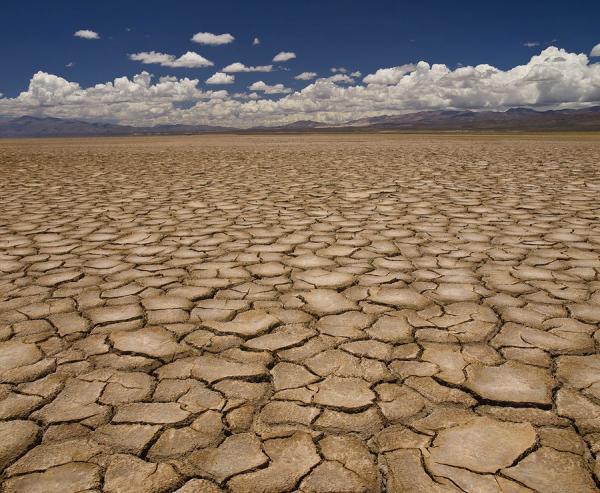
Drought in the United States - 2000 to 2014
Project #610 on iSENSEProject.org
Description
The data sets contained in this project show the percentage of the United States affected by different levels of drought: no drought, abnormally dry (D0), moderate drought (D1), severe drought (D2), extreme drought (D3), and exceptional drought (D4). One data set shows the percentage of the country in each individual category.
The other shows the cumulative percentage of the country at each drought level or a more extreme one: no drought, abnormally dry or dryer (D0-D4), moderate drought or dryer (D1-D4), severe drought or dryer (D2-D4), extreme drought or dryer (D3-D4), or exceptional drought (D4).
All data come from the National Drought Mitigation Center in Lincoln, NE: http://droughtmonitor.unl.edu/
Fields
| Name | Units | Type of Data |
|---|---|---|
|
Timestamp
|
|
Timestamp
|
|
No Drought
|
Percent
|
Number
|
|
Abnormally Dry
|
Percent
|
Number
|
|
Moderate
|
Percent
|
Number
|
|
Severe
|
Percent
|
Number
|
|
Extreme
|
Percent
|
Number
|
|
Exceptional
|
Percent
|
Number
|
Our Data
Name(s): ______________________________________
Date: _________________________________________
| Timestamp | No Drought | Abnormally Dry | Moderate | Severe | Extreme | Exceptional |