Water density changes with salinity and temperature
Project #628 on iSENSEProject.org
Description
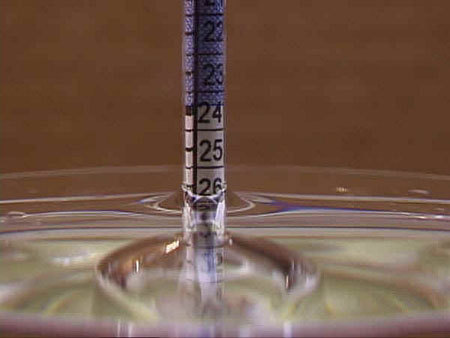
Investigate the relationships between ocean water salinity, temperature, and density by creating a diy hydrometer out of a test tube, one hole stopper, glass tubing, and lead shot. Salinity vs. Density data provides a simple linear relationship that supports student understanding of graphing linear equations.
Temperature vs. Density data contains inherent inaccuracies in the data collection that creates a scatter plot of the linear relationship allowing for exploring the concept of a best fit line to tease out the pattern.
Follow up activities explore the Mass and Volume changes that are occurring to cause the density effects observed.
Fields
| Name | Units | Type of Data |
|---|---|---|
|
Salinity
|
parts per thousand (ppt)
|
Number
|
|
Temperature
|
degrees Celsius
|
Number
|
|
Density
|
grams per ml
|
Number
|
Our Data
Name(s): ______________________________________
Date: _________________________________________
| Salinity | Temperature | Density |