

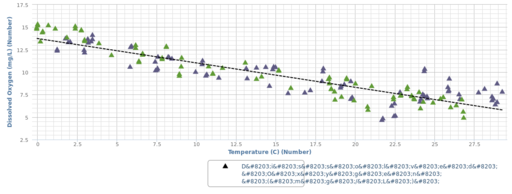
Temperature vs. Dissolved Oxygen with Best Fit Line
This scatter plot shows the relationship between water temperature and dissolved oxygen in the Charles River over a two-year period. In general, higher temperatures are correlated with lower dissolved oxygen levels.
Media
| File | Name | |||
|---|---|---|---|---|
|
|