

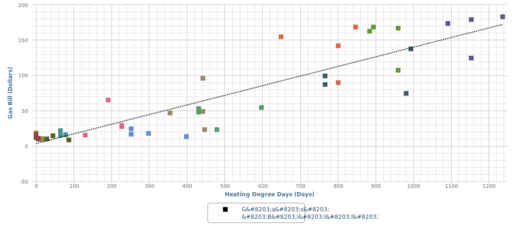
Scatter of Heating Degree Days vs. Heating Costs
This scatter plot shows the relationship between the heating degree days in a particular month and the cost of heating a home for that same month. There is a fairly tight linear relationship between these two variables. Note that, in the upper right corner of the plot, almost all points are in December, January, February, and March.
Media
| File | Name | |||
|---|---|---|---|---|
|
|