

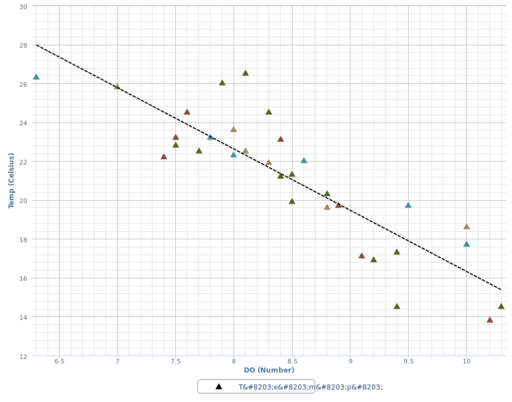
Dissolved Oxygen as function of Temperature - Merrimack Water Quality 2008
This scatter plot shows that as temperature increases, dissolved oxygen decreases.
Try turning on other sampling stations in the Groups menu. Some stations don't have as close as a correlation as the ones initially highlighted. Why would this be?
Media
| File | Name | |||
|---|---|---|---|---|
|
|