You are not currently logged in.


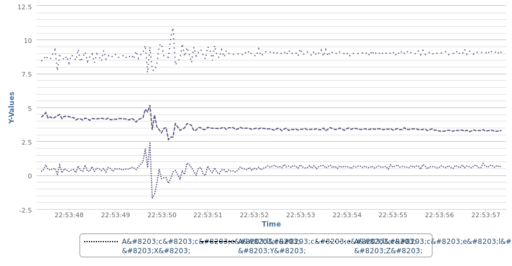
Acceleration in X, Y, and Z Axes during Crash Test
This timeline shows the acceleration values, captured using the iSENSE Android accelerometer app, in the X, Y, and Z axes during a crash test conducted at the USA Science and Engineering Festival on April 27, 2014. The X value is on the bottom, Y is in the middle, and Z is on the top. The difference in the range of values for each axis reflects the orientation of the Android device with respect to the constant, vertical, gravitational acceleration.
Media
| File | Name | |||
|---|---|---|---|---|
|
|