

Timeline of Velocity for Seven Stages
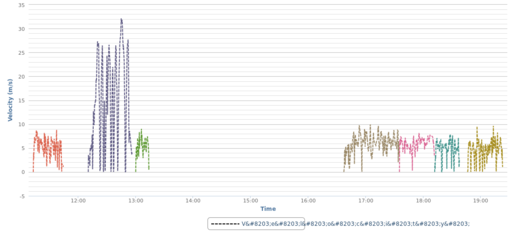
This timeline shows the velocity over time for the seven stages of the trip. The second stage (on the commuter rail) had the highest overall velocities, often exceeding 25 meters per second. There are three breaks in the data: 1) between stages 1 and 2, while waiting for the commuter rail; 2) between stages 3 and 4, during the Science of Rivers field trip; and 3) just before stage 7, when I stopped for groceries in Cambridge before heading home.
Media
| File | Name | |||
|---|---|---|---|---|
|
|