

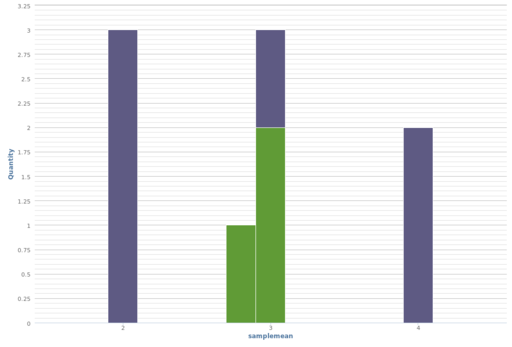
Central Limit Theorem Visualization -- mean values
Population consisted of one 1, two 2s, three 3s, and four 4s. In other words, ten items with an average value of 3.
Blue bars show that three 2s, two 3s, and two 4s were pulled. (You'd expect more 4s and fewer 2s.)
Green bars show mean value of nine pulls -- much closer to expected mean of exactly 3.
Media
| File | Name | |||
|---|---|---|---|---|
|
|