

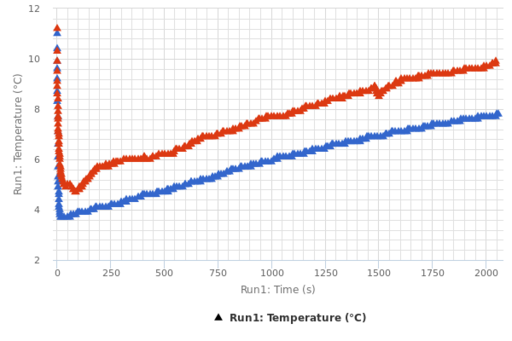
This graph shows the data for the both the soda can with the koozie and without the koozie. One must keep in mind that they started at different temperatures - presumably due to only having one probe and having to take the 2nd soda can out of the refrigerator 30+ minutes after the first one. Both cans had been in the pantry first and then put in the refrigerator - for about 2 hours, but I don't necessarily think they reached the ambient temperature of the refrigerator and therefore the 2nd can started at a lower temperature because it was in the refrigerator longer.
Though they did start at different temperatures, the difference in temperature of the soda can with the koozie was lower - a difference of 3.7 C in a 30 minute (1800 second) period - than the difference in the temperature of the soda can without the koozie - a difference of 4.7 C. Therefore, the data shows that the can did stay cold longer with the koozie on than off, by one degree in the 30 minutes.
But is this significant enough to justify using the koozie?
| File | Name | |||
|---|---|---|---|---|
|
|