Content
This release of iSENSE includes the following:
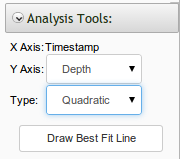
- Quadratic regressions on Timeline: Quadratic regressions are now available on timeline visualizations. Options to draw regressions are available in the visualization toolbar as shown below.

- Table visualization enhancements: The table visualization UI has been improved and sorting is now working properly. Users can click on column headers to sort data in ascending and desending order. Please note timestamps are sorted by date.
- An important reminder to users on Internet Explorer 9 and below: We only support Internet Explorer 10 and above. We recommend installing the latest version of Internet Explorer or switching to another browser, such as Chrome or Firefox, for optimal compatibility.