iSENSE Tutorials
We have added three video tutorials to help you learn how to use iSENSE. Please click the links below to view these tutorials:
http://isenseproject.org/tutorials/11
http://isenseproject.org/tutorials/12
http://isenseproject.org/tutorials/13
Setting Defaults for Visualizations
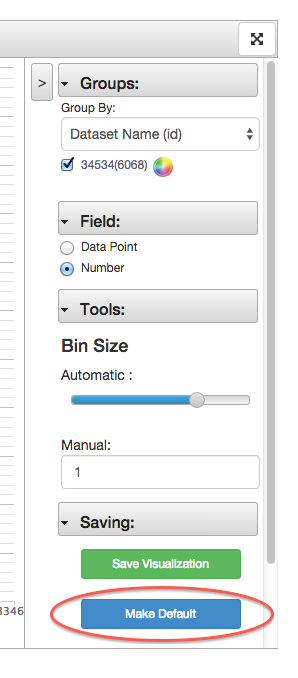
You can now set default visualization settings to best suit displaying data for a project you own. For example, if data for a project is best displayed on a bar visualization with a number field like temperature on the y axis, you can make this configuration your default for this project's bar visualizations. Every time you visualize data on a bar visualization for this project, temperature will be on the y axis. You can default any visualization setting, such as group by, analysis types, bin size, and so on, on the map, timeline, scatter, bar, histogram, pie, and table visualizations.
Important Note: Group selection (the checkboxes below 'Group By') will not be defaulted.
The control to set defaults for a visualization is in the visualization toolbar as shown below.
Searching for Projects by Project Number
In addition to searching for projects by keyword(s), you can now search for a specific project by its project number. A project’s number can be found on the project’s page under the title and owner as shown below.
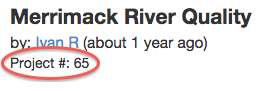
If you would like to search for a specific project, go the projects' search bar and type in that project’s number. Search will return one and only one result, and that result will be the project with that project number.
Adding YouTube Videos to Project Descriptions
Now you can add YouTube videos to project descriptions by just pasting the video link in the editor pane. Find a YouTube video you would like to add, copy the link in the address bar, and paste this link directly in a project's editor pane.
This release also offers bug fixes for the table visualizations and a few UI changes for projects and visualizations.