Over the past couple of weeks, the iSENSE team has been rolling out some great new features, bug fixes, UI tweaks, and API changes. Read on to learn more.
Slickgrid (Manual Entry Data Table) Improvements
Improvements to Slickgrid, our manual entry data table, makes manually contributing data to iSENSE a more seamless experience. Now, units for number fields are shown in the table; ten empty rows are added by default; holding down enter will add one more row of data; and validation messages are more clear and concise. We are working hard to refine Slickgrid to help guide you in manually contributing data.
Histogram as a Stacked Bar of Individual Points
The histogram visualization has been enhanced for small data sets so that each bar is represented as a stack of individual data items. This helps reinforce what a histogram really is: for each bin, a count of data elements that fit into that bin.
KML Layer Support
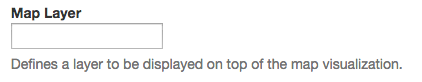
You can add one KML layer to visualizations. As defined by Google Maps, layers are objects on a map that consist of one or more items. KML layers renders KML or GeoRSS elements onto the map. To use this feature, please go to the projects edit page and paste a link to a KML file under Map Layer. You can host your KML file on iSENSE as a media object if you don’t want to link to a URL that might change.
In addition to these great changes, the page to add and edit fields and the photo visualization have gotten a facelift and images on the visualizations page are now clickable and take you directly to the respective visualization.
Check back soon for more features and enhancements!