Content
The iSENSE team has been working hard to bring you iSENSE v7.0 before our semester comes to a close. This release offers ground-breaking changes to make collecting, visualizing, and sharing data more intuitive for everyone. Read on to learn more about this release.
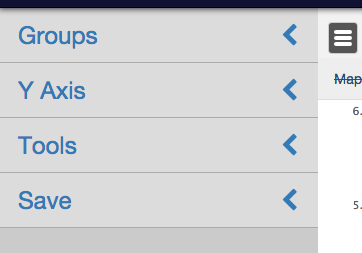
Beautiful New Visualization Tools
We take pride in building visualizations that assist you in getting the most from data analysis, and v7.0 offers completely restyled visualization tools to do just that. Visualizing data on iSENSE has never been so easy to do. Visualization tools are now located on the left part of the screen. All the previous visualization configuration options still exist, but they have been restyled (and even improved in some cases).

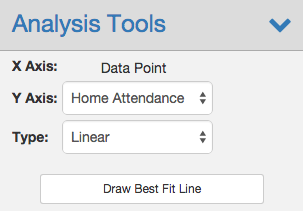
Advanced Regressions
We have expanded your mathematical analysis toolkit on iSENSE by adding symbolic regressions to Timeline and Scatter visualizations. Under Analysis Tools, simply select "Automatic" as Type, click "Draw Best Fit Line," and watch as iSENSE automagically generates a regression function that best fits your data. Additionally, regression lines now appropriately adjust as you zoom in and out on visualizations.
Edit Fields Page Makeover
Setting up projects is an important part of using iSENSE, and for that reason, we've redone our edit fields page to make your experience seamless. Simply add and delete number, text, timestamp, and location fields as you please, and then save. This new page makes it easy to setup and edit your project's fields.
Stay tuned as the iSENSE team continues to work hard to bring you new features, UI fixes, and more throughout the summer!