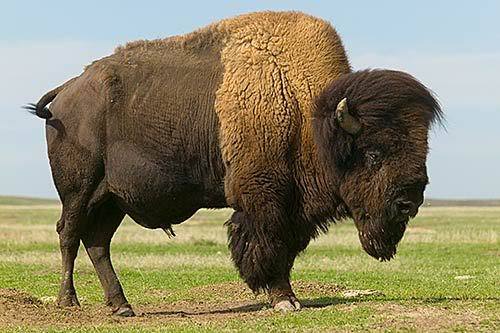
Bison Population Data
Project #1158 on iSENSEProject.org

This is the first of two fictitious data sets used for a user study entitled "Understanding Related Data Through Regression Analysis."
This user study was conducted as part of a research project by Jacob Kinsman under the advisement of Dr. Fred G. Martin. The project extended the regression controls featured within the iSENSE Timeline and Scatter visualizations with Symbolic Regression. Symbolic Regression attempts to automatically determine the mathematical function that describes the relationship between variables in data without a priori knowledge.
The user study was conducted to determine if Symbolic Regression is an effective tool for discovering the relationship between variables in complex data sets. This data set was constructed such that these relationships were pronounced. During the user study, participants were asked to analyze this data set, and use the iSENSE visualization suite to extract quantitative data regarding specific variables, and the mathematical relationship between them.
The paper describing the Symbolic Regression research and iSENSE user study can be viewed at: https://github.com/JKinsman/Honors-Project-Materials/blob/master/symbolic-regression-via-pareto-genetic-programming-honors-thesis-jkinsman.pdf
| Name | Units | Type of Data |
|---|---|---|
|
Date of Birth
|
None
|
Timestamp
|
|
Height
|
None
|
Number
|
|
Weight
|
None
|
Number
|
|
Tail Length
|
None
|
Number
|
|
Number of Legs
|
None
|
Number
|
|
Horn Length
|
None
|
Number
|
|
Snout Width
|
None
|
Number
|
|
Snout Height
|
None
|
Number
|
|
Tail Width
|
None
|
Number
|
|
Horn Width
|
None
|
Number
|
|
Dietary Preference
|
None
|
Text
|
|
Fur Color
|
None
|
Text
|
|
Disposition
|
None
|
Text
|
|
Eye Color
|
None
|
Text
|
|
Habitat
|
None
|
Text
|
|
Breed
|
None
|
Text
|
|
Name
|
None
|
Text
|
|
Legs
|
None
|
Text
|
|
Latitude
|
None
|
Latitude
|
|
Longitude
|
None
|
Longitude
|
| Date of Birth | Height | Weight | Tail Length | Number of Legs | Horn Length | Snout Width | Snout Height | Tail Width | Horn Width | Dietary Preference | Fur Color | Disposition | Eye Color | Habitat | Breed | Name | Legs | Latitude | Longitude |