 student
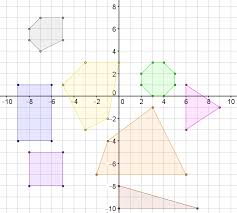
Coordinate Drawings and Translations
Project #1493 on iSENSEProject.org
Description
This lesson will be used as an extension to a project my 7th graders are currently working on using MS Excel. They will upload their project's dataset from their spreadsheet into iSENSE and will visualize and answer questions about it. Students completed work should be turned in through Google Classroom.
In this activity, students will focus on translations that are referred to as vector or glide translations. Students are going to:
- Create your own preimage on graph paper and translate it to form different images.
- Enter coordinates and graph a preimage in MS Excel and iSense.
- Add a scalar to these coordinates and graph the image formed by the new coordinates.
- Identify the translation by looking at the preimage and image together.
- Insert a scrollbar, and observe the translations that occur when different scalars are added to the coordinates. (in MS Excel)
- Upload the preimage and image dataset into iSense
Students will answer these questions in a Google Form (http://goo.gl/forms/9StexzM6nD) and turn it in through Google Classroom.
1. What happens to the image if you change the x-scalar only?
2. What happens to the image if you change the y-scalar only?
3. What is true about the scalar and coordinates when the image appears in the second quadrant?
4. What is true about the scalar and coordinates when the image appears in the third quadrant?
5. What is true about the scalar and coordinates when the image appears in the fourth quadrant?
Fields
| Name | Units | Type of Data |
|---|---|---|
|
y'
|
None
|
Number
|
|
x'
|
None
|
Number
|
|
Y
|
None
|
Number
|
|
X
|
None
|
Number
|
Our Data
Name(s): ______________________________________
Date: _________________________________________
| y' | x' | Y | X |