Faculty Reaction Time (clone)
Project #1570 on iSENSEProject.org
Today we are going to explore how quickly we can "react" to a stimuli (falling ruler)! With our data, we will be able to propose conclusions, based on evidence, on how factors affect someone's reaction time.
You have already discussed with your partner which factors affect reaction time, and made a claim on how your school, gender, or age could effect how you react to a stimuli. Here are the steps on obtaining your data points:
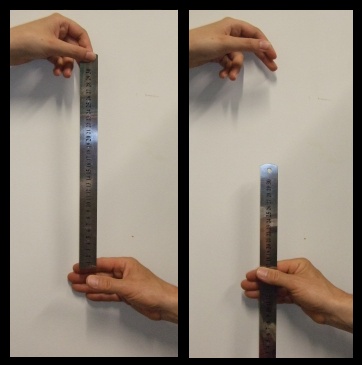
1. Have your partner hold their hand out, with a one inch gap between their thumb and index finger.
2. Hold a ruler, starting with zero, directly above the gap between the partner's fingers.
3. Drop the ruler - your partner needs to catch it! (Hint: Don't tell them when you are dropping it!). Record, in m, where your fingers caught the ruler. This is your distance, d.
4. Switch roles, and repeat steps 1-3.
5. Ensure you have your data in m, and solve for t, in seconds, using the equation:
t = SQRT(0.204*d)
6. Under the contribute data area, use the "Manual entry" method to enter your results. MAKE SURE YOU HAVE A TITLE OF THE DATA SET BEFORE YOU SUBMIT!
7. Use the visualization tool to create and interpret graphs of the data. Be sure to refresh the data set as more comes in!
8. Rationalize your claim based on the evidence collected and interpreted.
| Name | Units | Type of Data |
|---|---|---|
|
SCHOOL
|
|
Text
|
|
NAME
|
|
Text
|
|
AGE
|
YEARS
|
Number
|
|
GENDER
|
|
Text
|
|
REACTION TIME
|
SECONDS
|
Number
|
| SCHOOL | NAME | AGE | GENDER | REACTION TIME |