2015 New York City Female Marathon Winners
Project #1673 on iSENSEProject.org
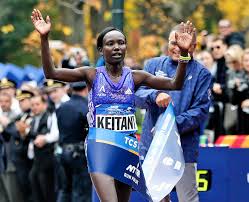
This i-sense project on the New York City marathon was another fun activity that reminded me of my home. We always followed the race and the excitement of the day. I thought that students could use it as a math/geography activity where they could practice basic math skills. I used the results of the top 20 winning females in the 2015 NYC marathon, and included their home countries. Data was taken from the New York Road Runners official website:
http://www.tcsnycmarathon.org/about-the-race/results/overall-women
Guiding Questions:
What country do you think had the most representatives? (Hint: Use the “Map” visualization and group by either name or country. Don’t forget to click on the markers as they may be hiding two or more data points.)
What was the difference in finishing times between Mary Keitany and Hilary Como? (Hint: Use the timestamp visualization.)
Using http://www.tcsnycmarathon.org/about-the-race/results/overall-men, compare the finishing times of the winners in both the male and female categories. What is the difference?
Identify the winners in the top 20 who were from the United States.
Compare the visualizations of marathon runners by run duration and finishing time. How do the graphs differ? Can you propose a reason why?
| Name | Units | Type of Data |
|---|---|---|
|
Run Duration
|
minutes
|
Number
|
|
Timestamp
|
|
Timestamp
|
|
Country
|
|
Text
|
|
Latitude
|
|
Latitude
|
|
Longitude
|
|
Longitude
|
|
Number
|
None
|
Number
|
|
Name
|
|
Text
|
| Run Duration | Timestamp | Country | Latitude | Longitude | Number | Name |