Mystic Herring Video Counts
Project #3593 on iSENSEProject.org
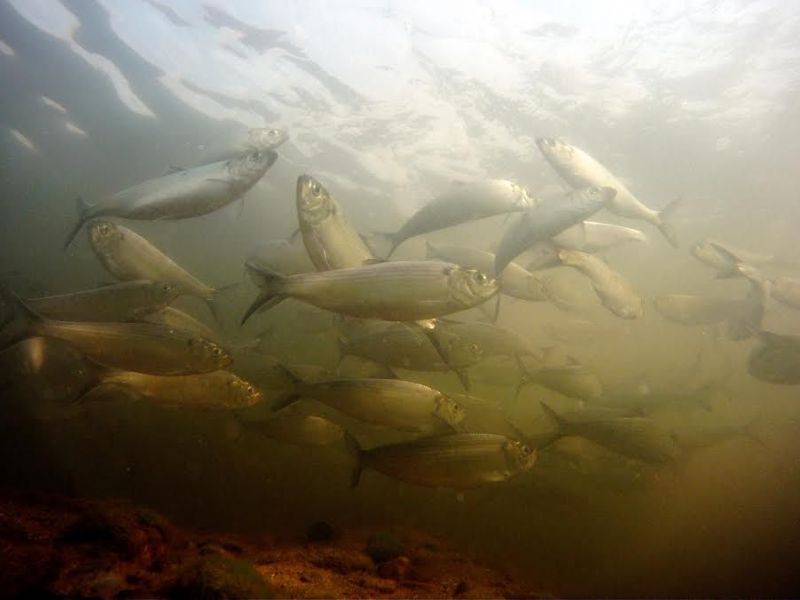
The Mystic River in Boston is host to the second largest river herring migration in Massachusetts. In 2017, more than 600,000 Alewife and Blueback Herring were estimated to have traveled up this highly urbanized river from saltwater to freshwater to spawn.
Our project developed a crowd-sourcing platform that allows volunteers to count herring on videos captured by an underwater camera. 50,000+ video clips were captured and more than 7,000 clips were counted. A total run estimate was generated from the sample counts.
Below are the numbers of herring actually counted each day during the migration of summer 2018. Click here to help us count and learn more about the river herring and the remarkable habitat restoration story on the Mystic, documented by citizen science!
Both data sets (Total Fish Counts and Number of Volunteer Counts) will display in the visualization. You can choose to look at one or both in the display under Group Selection. A helpful tool when visualizing the data is to change how the data is grouped. In the drop-down menu under Groups, change group by to Time Period. Time period can be changed in the drop-down under Tools, and can be seen hourly, daily, weekly, etc.
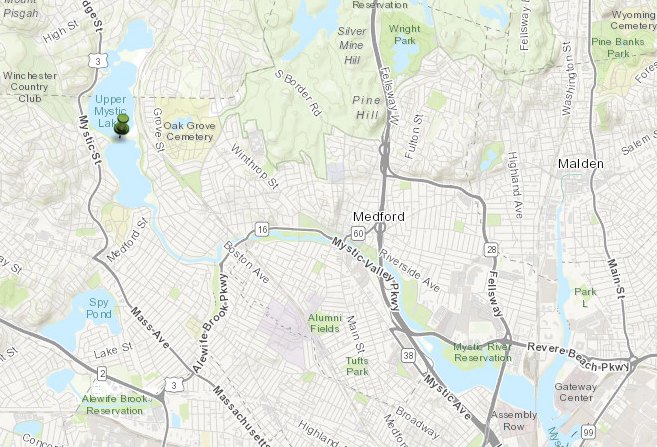
See the pushpin below for the location of the fish ladder:
| Name | Units | Type of Data |
|---|---|---|
|
Date
|
|
Timestamp
|
|
Total Fish Counted
|
None
|
Number
|
|
Latitude
|
|
Latitude
|
|
Longitude
|
|
Longitude
|
| Date | Total Fish Counted | Latitude | Longitude |