Charles River Water Quality 2011 to 2012
Project #420 on iSENSEProject.org
OVERVIEW
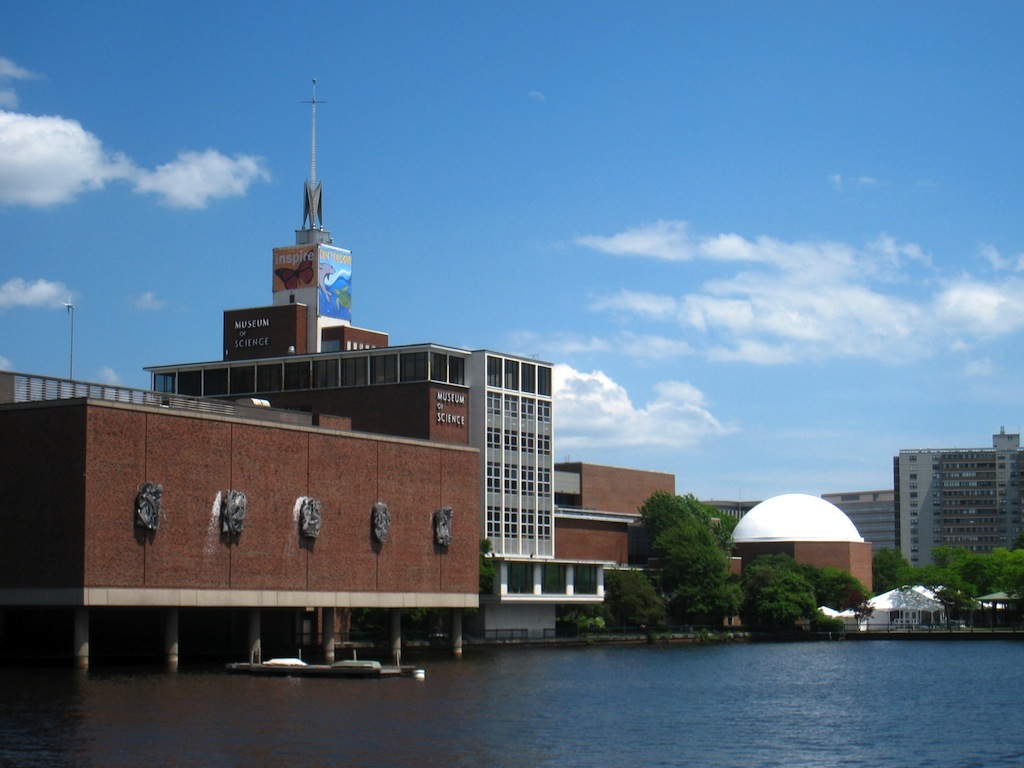
This data set contains water quality indicators for the Charles River over a two-year period from January 2011 to December 2012. The data set comprises measurements taken at two sampling stations: one upstream in Watertown, Massachusetts, and another in the Charles River basin at the Museum of Science Boston. Included are physical measures (such as temperature, pH, and salinity), nutrient levels (such as nitrate and phosphate), and levels of harmful bacteria (such as enterococcus and E. coli). Also included is a measure of the total rainfall, in inches, from the three days prior to the sample being taken.
SOURCE
Massachusetts Water Resources Authority, Environmental Quality Department http://www.mwra.state.ma.us/harbor/html/wq_data.htm
| Name | Units | Type of Data |
|---|---|---|
|
Date
|
|
Timestamp
|
|
Temperature
|
C
|
Number
|
|
Salinity
|
PSU
|
Number
|
|
Specific Conductance
|
mS/cm
|
Number
|
|
Dissolved Oxygen
|
mg/L
|
Number
|
|
pH
|
pH
|
Number
|
|
Turbidity
|
NTU
|
Number
|
|
Ammonium
|
uM
|
Number
|
|
Nitrate+nitrite
|
uM
|
Number
|
|
Particulate nitrogen
|
uM
|
Number
|
|
Phosphate
|
uM
|
Number
|
|
Total Phosphorus
|
uM
|
Number
|
|
Chlorophyll a
|
ug/L
|
Number
|
|
Phaeophytin
|
ug/L
|
Number
|
|
Enterococcus
|
no./100mL
|
Number
|
|
E. coli
|
no./100mL
|
Number
|
|
Rainfall (last 3 days)
|
.01 inches
|
Number
|
|
Latitude
|
|
Latitude
|
|
Longitude
|
|
Longitude
|
| Date | Temperature | Salinity | Specific Conductance | Dissolved Oxygen | pH | Turbidity | Ammonium | Nitrate+nitrite | Particulate nitrogen | Phosphate | Total Phosphorus | Chlorophyll a | Phaeophytin | Enterococcus | E. coli | Rainfall (last 3 days) | Latitude | Longitude |