Toggle navigation
Projects
Visualizations
Tutorials
News
Login
Register
Please enter a comment:
B
I
A
A
Link
Link:
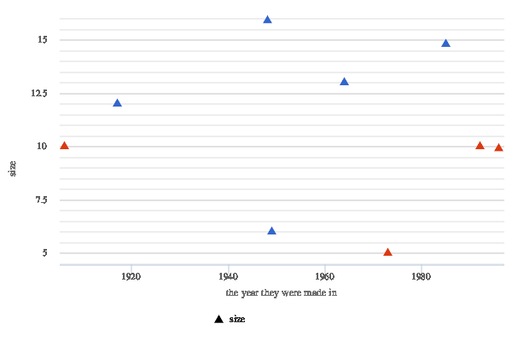
yearz and shoez
from
Shoes
by
pz and fn
Filters:
yearz and shoez
Media
File
Name
image.png

