Toggle navigation
Projects
Visualizations
Tutorials
News
Login
Register
Please enter a comment:
B
I
A
A
Link
Link:
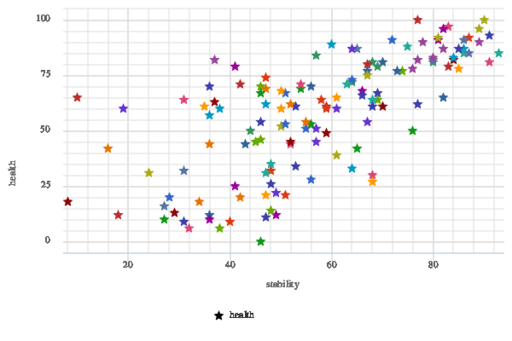
stabilty of a country compared to its health
from
quality of life based off country
by
Christopher Huerta
Filters:
stabilty of a country compared to its health
Media
File
Name
image.png

