Toggle navigation
Projects
Visualizations
Tutorials
News
Login
Register
Please enter a comment:
B
I
A
A
Link
Link:
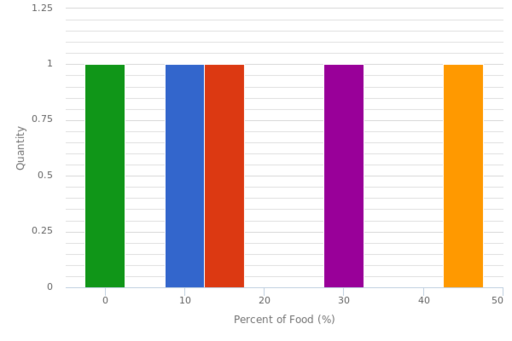
Rabbit Food-histogram
from
Which Graph is Best?
by
Mrs. Beaupre
Filters:
Rabbit Food-histogram
Media
File
Name
image.png

