 monty
monty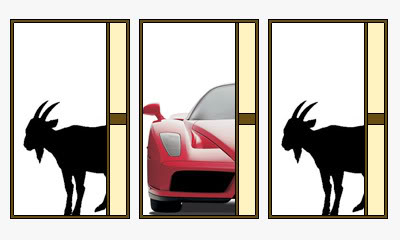
To Switch or Not to Switch?
Project #1465 on iSENSEProject.org
Description
To Switch or Not to Switch?
In this version of the classic Monty Hall problem, students will guess the probability of a paperclip being hidden under 1 of 3 cups. Students will first select the cup they believe is hiding the "prize" paperclip. After their partner lifts one of the other cups to reveal nothing underneath, the student has the choice of revising his original selection.
Is the prize hidden under the final cup ?
Students have to consider whether it is better to switch their choice to the new cup or to stick with their original choice. Is the probability of winning the prize better when switching - or not switching?
Procedure for collecting data
- Decide your role: either Switcher or Non-Switcher. The Non-Switcher guesses first.
- While the Non-Switcher turns his back, the Switcher lines up three cups and puts a paperclip under one of them. The Non-Switcher turns around, looks at the cups and selects one he thinks has the paperclip. The Switcher will then turn over one of the other cups that DOES NOT hold the paperclip. Since the Non-Switcher always decides to go with his first choice, the Switcher lifts the cups to reveal the location of the paperclip. Did the Non-Switcher win? Record the results for 15 trials.
- The Switcher guesses next. While the Switcher turns her back, the Non-Switcher will line up three cups and puts the paperclip under one of them. The Switcher turns around, looks at the cups and selects one she thinks has the paperclip. The Non-Switcher will then turn over one of the other cups that DOES NOT hold the paperclip. Since the Switcher always decides to switch, she will decide to go with the final cup. The Non-Switcher lifts the cups to reveal the location of the paperclip. Did the Switcher win? Record the results for 15 trials.
- Enter your results in iSense using the Key you have been given.
- After all data has been entered, go into iSense and view the default Visualization, which is a bar chart. From looking at this data, can you make a determination of whether it's better to Switch or Not to Switch?
- Look at the Pie Chart. Does this support your belief?
- What does the histogram tell you about the amount of wins and losses for Switchers and Non-Switchers?
Note: 26, 6th grade students took on the roles of Switcher or Non-Switcher, played the Monty Hall game and entered their data in iSense. The results are shown in the visualizations.
Fields
| Name | Units | Type of Data |
|---|---|---|
|
Losses
|
None
|
Number
|
|
Wins
|
None
|
Number
|
|
Role
|
None
|
Text
|
Our Data
Name(s): ______________________________________
Date: _________________________________________
| Losses | Wins | Role |