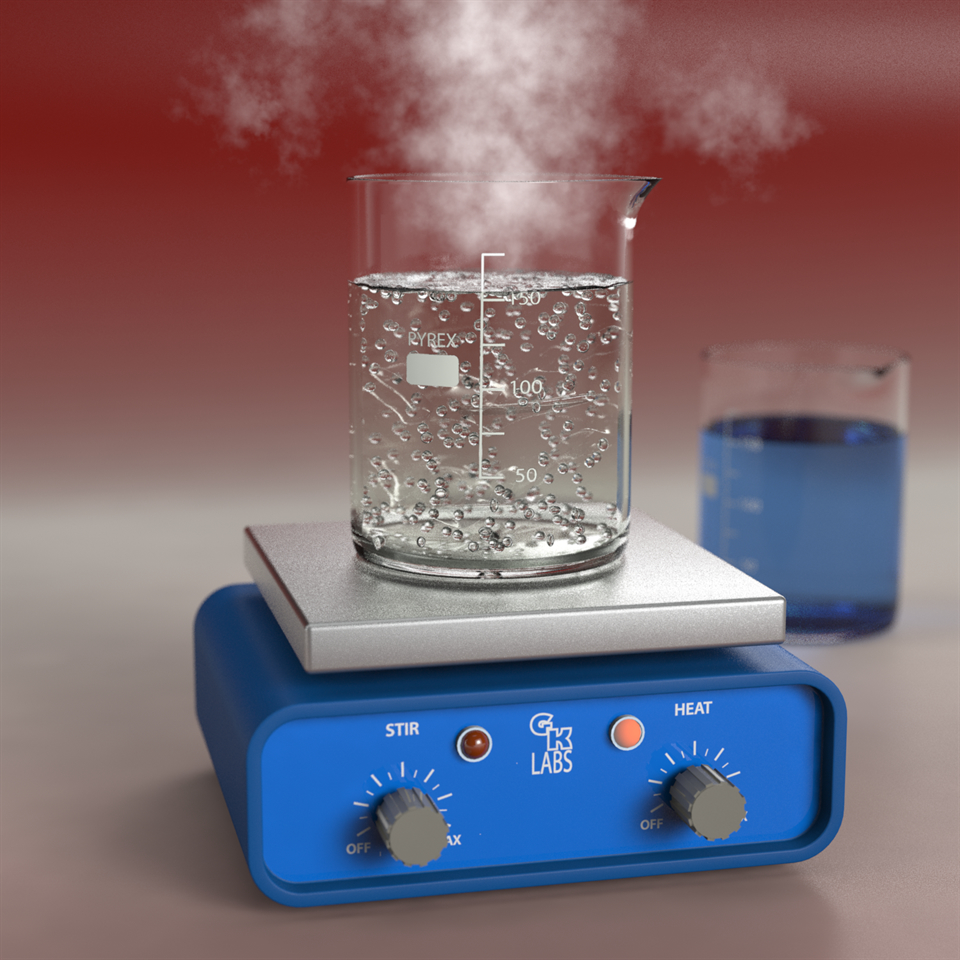
Boiling water
by: John Lagnese (over 8 years ago)


Project #1534

7646 Views
Description

This activity is designed to show that boiling point is constant and is a physical property of a substance. The addition of a solute will change a boiling point.


Does boiling change over time?

Does adding a solute change the boiling point?

Does the changed boiling point vary?


Boiling Water

Name______________________________ Section___________


Objective: This lab will show that boiling point is fixed and that adding solute can change boiling point.

Materials: 750 ml beaker, 100 ml graduated cylinder, 50 ml graduated cylinder, salt, chromebook, temperature sensor, and hotplate

Procedure:

  1. Gather all material.

  2. Use the 100 ml graduate to measure out 500 ml of water and add to 750 ml beaker.

  3. Turn hotplate to high and place beaker near center.

  4. While waiting, turn on chromebook to Graphical Analysis page and connect the temperature sensor.

  5. When water begins to boil place the sensor into beaker. Remember that this is hot!!!!!!

  6. After 15 seconds start to collect data for 60 seconds.

  7. Save data as boiling trial 1 as a csv file.

  8. Repeat and save as boiling water 2.

  9. Empty the beaker and repeat step 2.

  10. Use the 50 ml graduate to measure out 30 ml of NaCl and add to beaker.

  11. Repeat  steps 3 - 6 twice and save files as 30 ml salt 1 & 2.

  12. Repeat steps 9 - 11 and save files as 60 ml salt 1 & 2.


Data

  1. Open iSense project to http://isenseproject.org/projects/1534 .

  2. In visualizations, use a scattergram and sort the data with time on the X-axis and temperature on the Y-axis.

  3. View the data, this should be very similar to the save visualization.

  4. Answer the following questions.


Analysis

  1. Describe the scattergam. Be sure to include the grouping pattern of the data.

  2. Did any of the three data groups vary significantly over the 60 second time period? How does the graph show this?

  3. Use the data to explain that boiling point is a fixed property of a substance and so constant.           

  4. How did the temperature of the three data groups compare?  What does this show about adding solute to a liquid?

  5. Write a two paragraph conclusion describing boiling point and the addition of a solute. Use the data and graph to support the position.
Fields
Name Units Type
Run1: Time (s)
None
Number
Run1: Temperature (°C)
None
Number
Formula Fields
Contribute Data
Please log in to contribute data

Boiling water

Project #1534 on iSENSEProject.org


Description

This activity is designed to show that boiling point is constant and is a physical property of a substance. The addition of a solute will change a boiling point.


Does boiling change over time?

Does adding a solute change the boiling point?

Does the changed boiling point vary?


Boiling Water

Name______________________________ Section___________


Objective: This lab will show that boiling point is fixed and that adding solute can change boiling point.

Materials: 750 ml beaker, 100 ml graduated cylinder, 50 ml graduated cylinder, salt, chromebook, temperature sensor, and hotplate

Procedure:

  1. Gather all material.

  2. Use the 100 ml graduate to measure out 500 ml of water and add to 750 ml beaker.

  3. Turn hotplate to high and place beaker near center.

  4. While waiting, turn on chromebook to Graphical Analysis page and connect the temperature sensor.

  5. When water begins to boil place the sensor into beaker. Remember that this is hot!!!!!!

  6. After 15 seconds start to collect data for 60 seconds.

  7. Save data as boiling trial 1 as a csv file.

  8. Repeat and save as boiling water 2.

  9. Empty the beaker and repeat step 2.

  10. Use the 50 ml graduate to measure out 30 ml of NaCl and add to beaker.

  11. Repeat  steps 3 - 6 twice and save files as 30 ml salt 1 & 2.

  12. Repeat steps 9 - 11 and save files as 60 ml salt 1 & 2.


Data

  1. Open iSense project to http://isenseproject.org/projects/1534 .

  2. In visualizations, use a scattergram and sort the data with time on the X-axis and temperature on the Y-axis.

  3. View the data, this should be very similar to the save visualization.

  4. Answer the following questions.


Analysis

  1. Describe the scattergam. Be sure to include the grouping pattern of the data.

  2. Did any of the three data groups vary significantly over the 60 second time period? How does the graph show this?

  3. Use the data to explain that boiling point is a fixed property of a substance and so constant.           

  4. How did the temperature of the three data groups compare?  What does this show about adding solute to a liquid?

  5. Write a two paragraph conclusion describing boiling point and the addition of a solute. Use the data and graph to support the position.

Fields
Name Units Type of Data
Run1: Time (s)
None
Number
Run1: Temperature (°C)
None
Number

Our Data
Name(s): ______________________________________
Date: _________________________________________

Run1: Time (s) Run1: Temperature (°C)