Toggle navigation
Projects
Visualizations
Tutorials
News
Login
Register
Please enter a comment:
B
I
A
A
Link
Link:
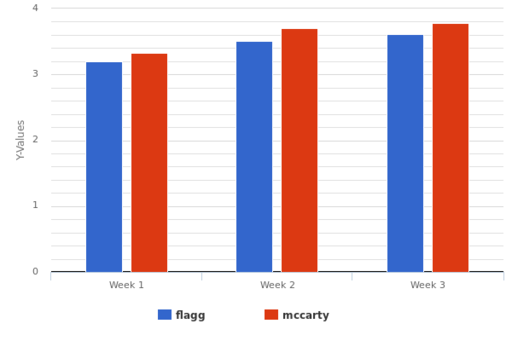
3 week trend by homeroom
from
Frontrow Data
by
Mrs. Flagg
Filters:
3 week trend by homeroom
Media
File
Name
image.png

