You are not currently logged in.
Latest

2/4/23 | Version 9.9.0
This release provides the following new features:
- Visual change on the Table equality operator from “==” to “=”.
The following bugs were fixed:
- Strengthened site security to enforce user inputs match predefined allowed values.
- Updated Ruby libraries and dependencies.
- Fixed deprecation warning relating to password confirmation.
All News
3/13/15 | iSENSE v6.4 Release
Over the past couple of weeks, the iSENSE team has been rolling out some great new features, bug fixes, UI tweaks, and API changes. Read on to learn more.
Slickgrid (Manual Entry Data Table) Improvements
Improvements to Slickgrid, our manual entry data table, makes manually contributing data to iSENSE a more seamless experience. Now, units for number fields are shown in the table; ten empty rows are added by default; holding down enter will add one more row of data; and validation messages are more clear and concise. We are working hard to refine Slickgrid to help guide you in manually contributing data.
Histogram as a Stacked Bar of Individual Points
The histogram visualization has been enhanced for small data sets so that each bar is represented as a stack of individual data items. This helps reinforce what a histogram really is: for each bin, a count of data elements that fit into that bin.
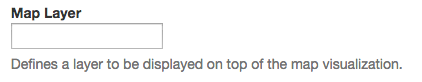
KML Layer Support
You can add one KML layer to visualizations. As defined by Google Maps, layers are objects on a map that consist of one or more items. KML layers renders KML or GeoRSS elements onto the map. To use this feature, please go to the projects edit page and paste a link to a KML file under Map Layer. You can host your KML file on iSENSE as a media object if you don’t want to link to a URL that might change.
In addition to these great changes, the page to add and edit fields and the photo visualization have gotten a facelift and images on the visualizations page are now clickable and take you directly to the respective visualization.
Check back soon for more features and enhancements!
1/29/15 | iSENSE v6.0 Release
The iSENSE team is proud to introduce iSENSE v6.0. This releases offers several new features, bug fixes, UI tweaks, API changes, and more. Interested in learning about what’s new? Keep on reading!
New Manual Entry Table: Slickgrid
Manually contributing data to iSENSE just got easier with our new data entry table called Slickgrid. Slickgrid makes it easy to add, delete, and edit data. Its very slick (pun intended), easy-to-use interface makes contributing data a seamless experience.
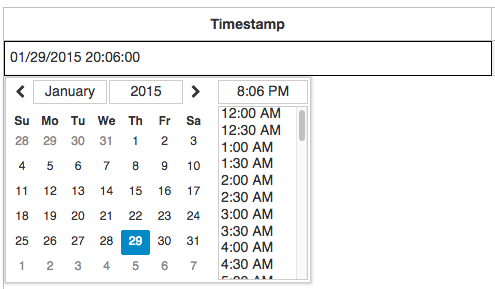
What's great about Slickgrid? It validates all data contributed to projects. For example, it ensures a given latitude and longitude are valid location values. Additionally, Slickgrid makes it easy to enter a timestamp by allowing you to select date and time values on a calendar as shown below.
To use Slickgrid,
1. Go to a project you want to contribute data to.
2. Under Contribute Data, click Manual Entry.
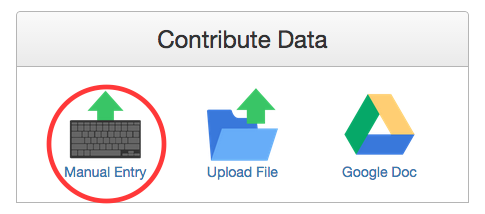
3. Then… Huzzah! You're ready to use Slickgrid.
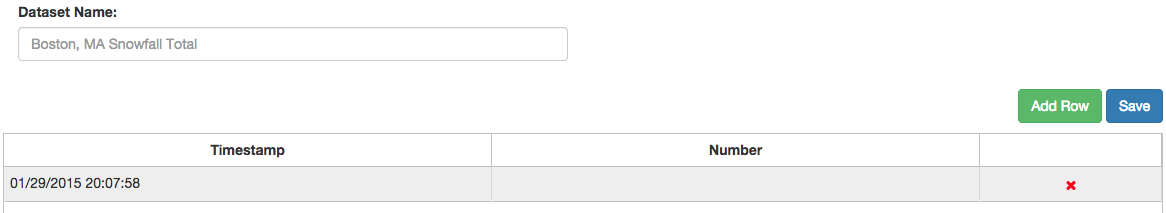
Click the red "X" to delete rows of data. Click "Add Row" to add a row of data. Click "Save" to save your dataset.
Updated Contact Page
Our contact page got a facelift, AND we’ve added the newest iSENSE members. We are pleased to welcome Samantha Michalka, Anthony Salani, Jason Downing, Jeremy Daigneau, and Tyler Puleo to the team! Visit the contact page to meet our team or get in touch if you're interested in working with us.
Bug Reporting
Have you ever discovered a bug using iSENSE? Maybe a button wasn’t working or a page didn’t load. Or have you ever thought, “I wish could do _______ on iSENSE...”? If the answer to either (or both) of those questions is yes, you’re in luck.
You can now report bugs or suggest features using our new bug reporting feature. The link to report a bug is in the footer as shown below. Simply click this link to begin the bug reporting process.

All bug reports will be posted to our public issue repository on GitHub.com. Don't have a GitHub account? No problem! You can still report bugs. However, we advise you not to include personal information, e.g. your name or email, in your bug report because this information will publicly be available on GitHub.com. We encourage you to be as specific as possible when filling on the bug reporting form, though.
Select-All Option for Y-Axis Fields on Visualizations
You now have the option to select all y-axis fields by simply checking the "Select-All" checkbox on visualizations.
New API Function
We've added a new function to our API that enables you to add a contributor key to a project. Please see the documentation for more information.
Spring 2015 semester just started, and the iSENSE team is working hard. We have many great features in the queue, so check back soon!
11/7/14 | iSENSE v5.10 Release
iSENSE v5.10 introduces new features for pie charts and summary visualizations as well as improvements to our text editor, Summernote, and visualizations.
Analysis Types for Pie Charts
Pie charts just got a more powerful with analysis types. Like on bar charts, you can now analyze the total, maximum, minimum, mean (average), median, and row count of your data on pie charts.
New Features for Summary Visualizations
You can now save and set defaults on summary visualizations, and we now also support data grouping on summary visualizations to provide you even more ways to display your data.
SVG Images Supported in Summernote
Our text editor, Summernote, now supports uploading SVG images.
In addition to all these wonderful new features, this release offers many improvements to visualization, project creation, and our text editor UI.
10/10/14 | iSENSE v5.9 Release
iSENSE Tutorials
We have added three video tutorials to help you learn how to use iSENSE. Please click the links below to view these tutorials:
http://isenseproject.org/tutorials/11
http://isenseproject.org/tutorials/12
http://isenseproject.org/tutorials/13
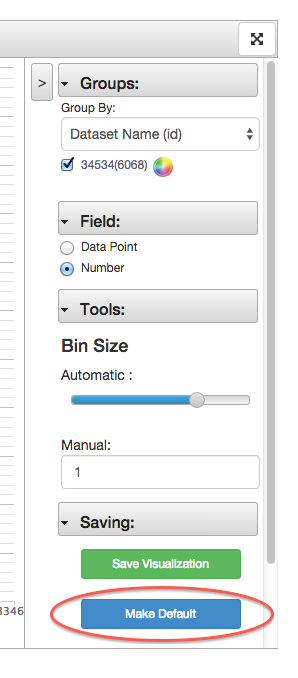
Setting Defaults for Visualizations
You can now set default visualization settings to best suit displaying data for a project you own. For example, if data for a project is best displayed on a bar visualization with a number field like temperature on the y axis, you can make this configuration your default for this project's bar visualizations. Every time you visualize data on a bar visualization for this project, temperature will be on the y axis. You can default any visualization setting, such as group by, analysis types, bin size, and so on, on the map, timeline, scatter, bar, histogram, pie, and table visualizations.
Important Note: Group selection (the checkboxes below 'Group By') will not be defaulted.
The control to set defaults for a visualization is in the visualization toolbar as shown below.
Searching for Projects by Project Number
In addition to searching for projects by keyword(s), you can now search for a specific project by its project number. A project’s number can be found on the project’s page under the title and owner as shown below.
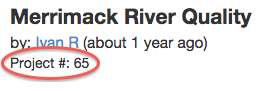
If you would like to search for a specific project, go the projects' search bar and type in that project’s number. Search will return one and only one result, and that result will be the project with that project number.
Adding YouTube Videos to Project Descriptions
Now you can add YouTube videos to project descriptions by just pasting the video link in the editor pane. Find a YouTube video you would like to add, copy the link in the address bar, and paste this link directly in a project's editor pane.
This release also offers bug fixes for the table visualizations and a few UI changes for projects and visualizations.
9/26/14 | iSENSE v5.8 Release
The iSENSE team has released v5.8 and is excited to introduce the following new features:
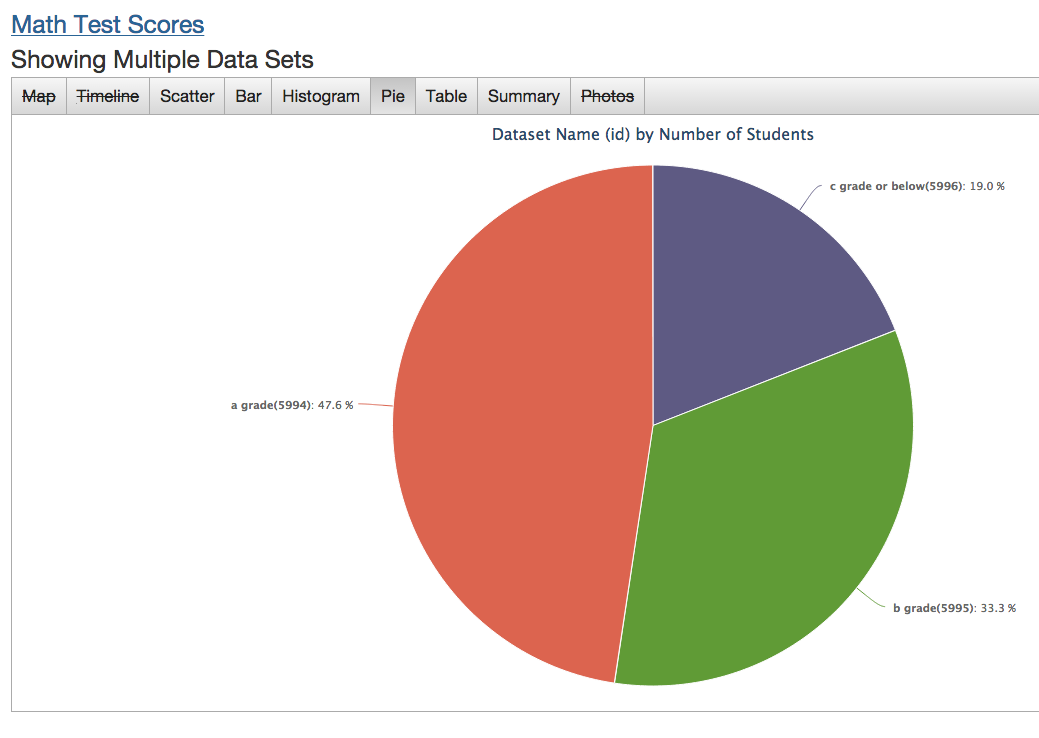
Pie Charts
Pie charts offer another “delicious” way to visualize and analyze your data.
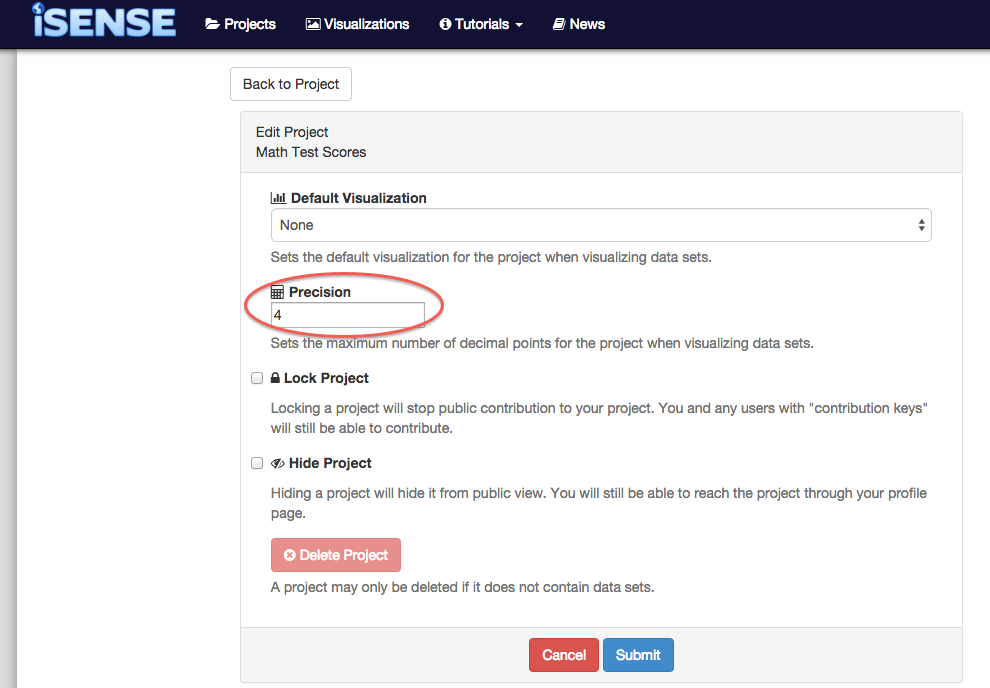
Configurable Floating Point Precision for Visualizations
With configurable floating point precision, you can control the precision of your data to make bar and summary visualizations more readable. For example, 2.349874 will appear as 2.35 if you set your project's floating point precision to be 2.
Four is the default number of decimal points, but you can configure precision in a project’s settings. To access a project’s settings, go to the project page, and click the Edit button as shown below.
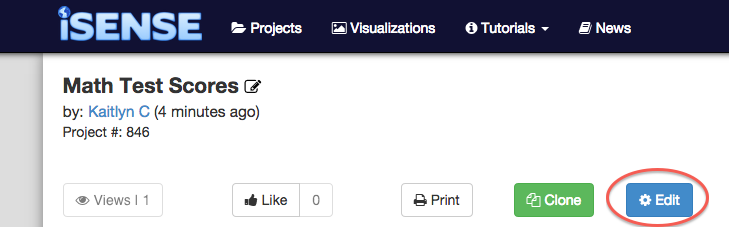
On the project's settings page, enter a number into the precision input box to set the project's floating point precision.
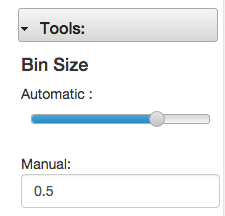
Better Bin Sizing Controls on Histogram Visualization
Bin sizing controls have been improved to make visualizing data on histograms a more seamless experience. To increase the bin size on a histogram visualization, move the slider to the right. To decrease the bin size, move the slider to the left. You can also manually set the bin size by entering a number into the manual input box.
... and more!
In addition to these wonderful new features, this release offers new bugs fixes for regression tools, bar chart sorting, and field matching as well as UI tweaks on the embedded visualization pages.
9/10/14 | v5.7 and the Future of iSENSE
iSENSE v5.7 is released. This version introduces a check-all box for y-axis values on all visualizations as well as bug fixes and UI tweaks.
Looking ahead, the iSENSE website development team plans to deliver several new features:
- A new and improved manual entry table and associated date/time pickers to make manually uploading data a seamless experience
- Defaults for visualizations giving you the ability to customize your data analysis
- Pie chart visualization, which offers you another way to analyze your data
-
Video tutorials to guide you in getting the most from your iSENSE experience
- A new homepage that clearly illustrates what iSENSE is all about
- The ability to login with your Gmail account
- Bug fixes, UI tweaks, and more!
Stay tuned...
8/26/14 | iSENSE v5.6 Rlease
The iSENSE team has released version 5.6.
The following additions have been made to the website since 5.5:
- Better error handling and feedback for field creation by uploading a file.
- Much faster upload times for large ODS, XLS, and XLSX files.
- Improvements for field selection in Scatter, Bar, and Timeline charts.
- Various UI tweaks and bug fixes.
8/6/14 | iSENSE v5.5 Release
The iSENSE team has released version 5.5.
The following additions have been made to the website since 5.2:
- Cloning a project will now preserve the order in which data sets were contributed.
- Project descriptions are now copied when a project is cloned.
- Enhanced full screen visualizations
- Enhanced the user interface for the visualization's color picker
- Rounding for summary visualizations
- Various UI improvements and bug fixes
6/6/14 | iSENSE v5.2 Release
The iSENSE team has released version 5.2.
The following additions have been made to the website since 5.1:
- Enhanced layout for the Photos Visualization
- Projects can now be deleted from their users page.
- Projects can now be hidden, preventing them from being viewed by other users.
- User Interface improvements were made throughout the site, primarily related to the new rich text editor.
5/24/14 | iSENSE v5.1 released
The iSENSE team has released version 5.1
The following additions have been made to the website since 5.0:
- Bar charts are automatically sorted to make data easier to understand.
- Summary tab on the visualization page shows basic stats for a data set.
- Enhancements to data export.
- Projects without images get stock images in the project list.
- New rich text editor.
- Simplification of some user interface elements.
- Various bug fixes and new bugs added.